

I get it.
It’s scary.
Especially these days, with the S&P 500 just 2.6% off its all-time high of 4725.79 set on Dec 23, 2021 (see closing-price chart below), and with the index swinging up and down by over 1% almost daily.
And seeing how bear markets can wipe out half or more of your portfolio, usually taking years to come back doesn’t make it any easier to sleep well.
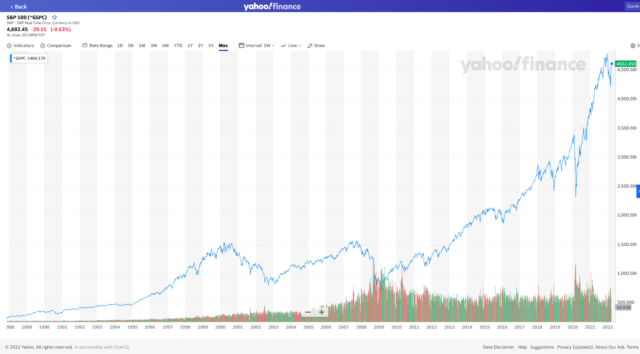
S&P 500 weekly closing prices 1988-2022 show we’re just 2.6% below its highest-ever close. The chart also shows three bear markets, 2000-2002, from 2007-2009, and the V-shaped bear of March 2020. (Chart from Yahoo Finance)
In 2021, according to Reuters, the S&P 500 reached record highs 68 times, the highest frequency in a generation, and the second-highest in history.
How much higher can it go?
Or more worryingly, how far will it drop, and how soon?
Investing with Near-Complete Safety
Say you’re 25, and you’re fortunate enough to have a decent job paying the median US income for Americans from age 25 to 35, $71,566 according to Statista.
While we’re at it, let’s say you’re also savvy and frugal enough to set aside 15% of your pre-tax income for your future self’s retirement. That’s $895/month.
Kudos!
And if we’re gonna make all these rosy assumptions, let’s say you’ll be investing that same amount each and every year (increasing the number of dollars to adjust for inflation), for the next 45 years.
If you don’t want to take any risk like investing in stocks, and instead invest 100% in bonds, you’d end up with somewhere between $280k and $1.6 million (in today’s dollars).
The average? $830k.
Here’s the distribution of your future nest egg value in millions of dollars at age 70, using 1274 rolling 45-year periods (each offset by a month from the previous), starting all the way back in 1871. Each bar shows how many rolling 45-year periods end up in that bar’s specific $150k range – for example, ~270 of the 1274 rolling 45-year periods would have resulted in a nest egg between $450k and $600k.

Not too shabby, right?
That’s about 12x your current income.
But wait! If we assume your income grows at 2%/year in real terms, it’s only 5x your final salary!
Considering that most experts recommend accumulating between 10x and 16x your final salary, that average won’t fund a great retirement.
And if we look at the minimum outcome, that’s a measly 1.7x your final salary.
Not good at all!
Use My Trick of Becoming Wealthy with No Penny Pinching
Here’s a trick I’ve been using for over a decade now (I’d have started earlier had I thought of it sooner).
Anytime my income increases, I invest at least half of the increase for retirement (I actually target 2/3). Since I let myself spend the rest, our standard of living actually goes up as we increase our savings rate!
Say you decide to do exactly that, sticking with your 100% bond strategy.
Here’s how it would work. Your initial salary was $71,566 and you’d invest 15% of that, or $10,773 (about $895/month). The following year, we assume your salary goes up 2%, or $1421 to $72,987. You let yourself spend half of that increase, but allocate the other half to bolster your savings, from $10,773 to $11,484.
This increases your savings rate from 15% to 15.7%, while letting you spend more.
The following year, we assume you get another 2% bump, or $1460 to $74,447. Again, you allocate half of that $1460 increase to your savings, raising it from $11,484 to $12,214. That raises your savings rate from the second year’s 15.7% to 16.4%, and again you get to improve your standard of living at the same time.
Each further year, you bump your investment by half of the 2% increase. By year 45, your savings rate has painlessly increased to 35.4%!
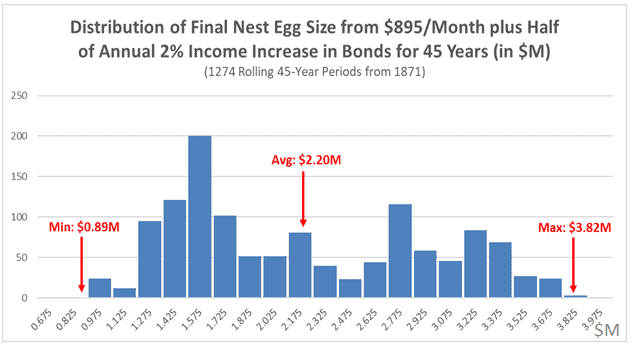
As the following chart shows, history says your eventual outcome will most likely fall between $890k and $3.8 million, with an average of $2.2 million (in today’s dollars).
How good is that compared to your income?
The average is 13x your final salary - that could work.
But what if you’re unlucky and the next 45 years match the worst on record since 1871? In that case, you’d end up with just 5x your final salary. Less than half what most experts recommend.
Here’s a table of all those results:

Clearly, the best outcome for a steady 15% isn’t good enough, while even the average outcome is ok if you increase your savings rate each year.
The worst-case, however, is unacceptably bad.
Can’t we do better?
Why You Shouldn’t Worry About Stock Market Losses if You’re Investing for the Long Haul
Let’s keep all our previous assumptions, except that you decide you can tough out the gyrations of the stock market and never panic-sell.
You decide to invest 100% in stocks.
Now your outcome is between $950k and $7.1 million, with an average of $3.1 million (all in today’s dollars).
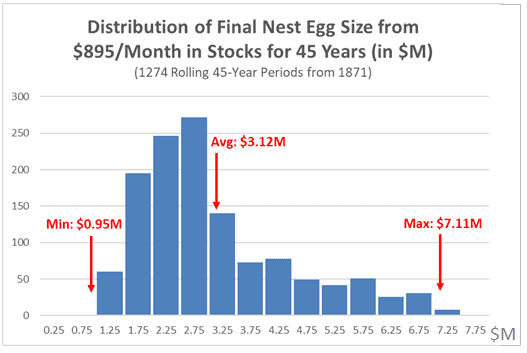
The average is a great 18x your final salary, but the worst-case is 5.6x. Far better than bonds’ 1.7x worst-case, but still not good enough.
The “No Penny Pinching” Method with Stocks
Using my trick to increase your savings rate each year comes through for you!
Your eventual outcome is most likely going to be between $2.1 million and $13.5 million, with an average of $6.4 million.
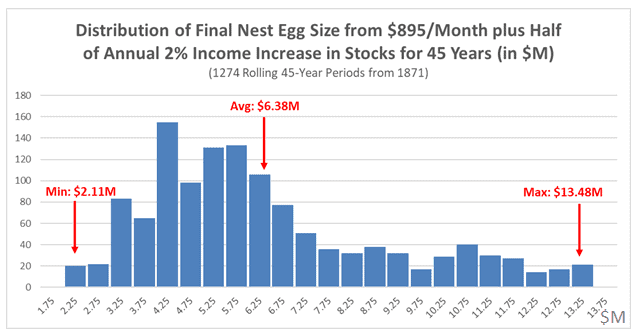
That’s an astonishing 37x your final salary for the average, and an acceptable 12x as the worst case!

Getting a Little More Real
Since we’re living in reality, let’s not kid ourselves that you’ll start investing 15% of your income from age 25 and continue until age 70.
Let’s instead assume you invest for “only” 30 years.
Whether that’s starting at age 25 and retiring at age 55, or starting at age 37 and retiring at 67, this is a more plausible (though still hard!) scenario.
How’s Investing 100% in Bonds for 30 Years? (Hint: Not So Great)
Let’s recreate the same analyses for the 1454 rolling 30-year periods since 1871, each shifted again by a month relative to the previous one.
Keeping a straight 15% savings rate gives you a likely outcome between $200k and $890k, with an average of $480k.
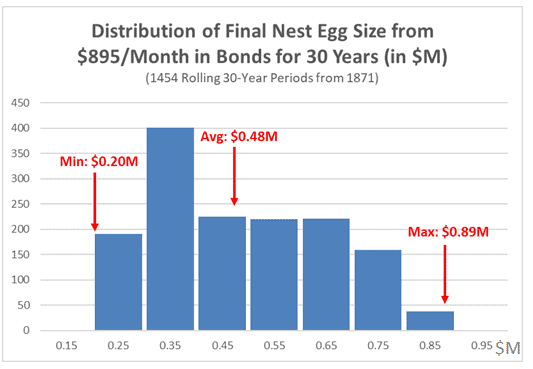
That’s only 4x your final salary for the average case, and a measly 1.6x worst case.
Use my trick to increase your savings rate, and your result ends up between $450k and $1.7 million, with a $960k average.

In multiples of your last salary, that’s a not-quite-there 8x average, and a not-so-good 4x in the worst case. Even the best-case scenario gives you only a moderately acceptable 13x.

Stocks for the (30-Year) Win (in Most Cases)!
If you do the same steady 15% for 30 years investing in stocks instead, you end up with between $360k and $2.3 million, with an average of $1.1 million.
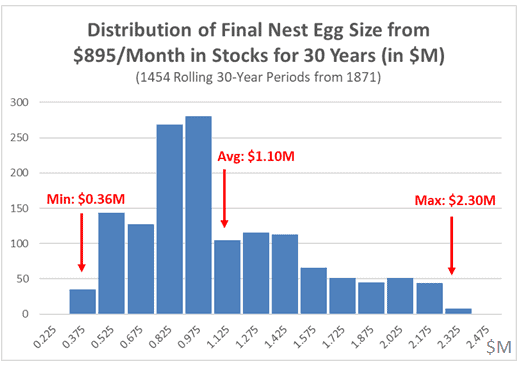
That’s a still-not-quite-there average of 9x your final salary, and an unacceptable 2.8x worst case.
Increase your savings rate each year as above, and you end up with between $670k and $4.1 million, with an average of $1.9 million.
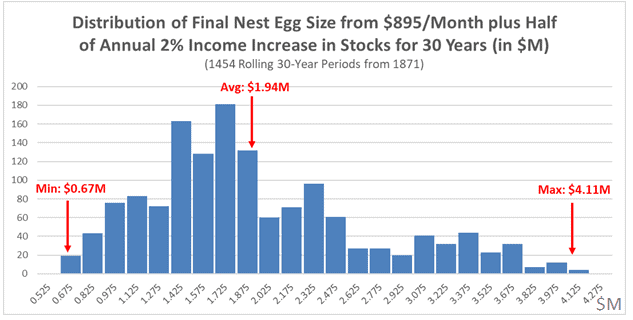
What’s that in last-salary multiples?
The average is a healthy 15x, while the worst case is a still-unacceptable 5x.

The saving grace here is that 80% of historical outcomes bring you to more than 10x your final salary, and the average outcome is significantly better than bonds’ best-case outcome.
The Bottom Line
Historical data from Yale economist Robert Shiller dating back to 1871 show that investing in stocks for the long haul handily beats investing in bonds. Comparing worst-case outcomes after 30 years shows stocks win by a landslide.
While bonds’ worst case ends up losing over 37% of your total investment (in real terms, assuming an inflation-adjusted constant of $895/month), for stocks that number is an 11% gain – and that’s worst case.
For the average case, bonds increase your total investment by 49%, while stocks outstrip that with an astounding 240% increase!
In general, the longer you invest, the less growth you’ll need; but perhaps perversely, the less risky it will be to invest in the stock market.
If you’re starting late, you’ll need to set aside a lot more. For example, starting at age 32 instead of 22 requires you to nearly double your annual investment and starting at age 42 more than doubles it again!
That’s why you need to start investing as soon as possible, as much as possible consistent with living a life worth living. It’s also why investing in stocks (with at least a healthy portion of your portfolio) is likely to give you a better outcome.
Caveats and Alternatives
The average historical returns for stocks and bonds are 7.0%/year and 2.6%/year, respectively (adjusting for inflation). That’s why investing 100% in stocks has historically beat investing 100% in bonds. However, that assumes you have the guts to stick with it through thick and thin, whether the market soars 30%, or drops a sickening 50%.
Few people do.
That’s why most financial advisors recommend a less aggressive stance. Here are three examples:
- A constant 60/40 stocks/bonds portfolio (sticks with 60% in stocks and 40% in bonds at all ages)
- A stock percentage glide path of 100 minus your age (e.g., 65% stocks at age 35 and 35% at age 65)
- A stock percentage glide path of 120 minus your age (e.g., 85% stocks at age 35 and 55% at age 65)
Let’s try to get a sense of how your returns may vary if you follow these more conservative alternatives.
If you invest, e.g., $895/month in real terms in stocks for 45 years, you’d expect to get to about $3.3 million. Invest in a 60/40 portfolio of stocks and bonds instead, and that drops to $1.9 million, 41% less.
Use the most aggressive of these more conservative alternatives, 120 minus your age as your stock percentage, and $895 (inflation-adjusted) invested each month would (on average) get you to an inflation-adjusted $2.3 million, 32% less than the average outcome with a constant 100%-stock allocation.
As you can see, anything less aggressive than 100% stocks won’t perform as well on average. However, if keeping your portfolio less aggressive lets you sleep well and avoid panic-selling at the bottom of a bear market, it’s likely the right choice for you.
Disclaimer
This article is intended for informational purposes only, and should not be considered financial, investment, business, tax, or legal advice. You should consult a relevant professional before making any major decisions.
Leave a comment